Time series decomposition — ETS model using Python
A guide to understanding and implementing ETS model for time series data using Python.
What is time series decomposition?
Time series decomposition is the breaking down of the series into its trend, seasonality and noise components. It helps in understanding the time series data better while using it to analyze and forecast.
What is ETS model?
ETS stands for Error-Trend-Seasonality and is a model used for the time series decomposition. It decomposes the series into the error, trend and seasonality component. It is a univariate forecasting model used when dealing with time-series data. It focuses on trend and seasonal components. This model consists of various concepts like trend methods model, exponential smoothing and ETS decomposition.
It helps in creating a model to fit the data by using the three key factors: error, trend and seasonality. The ETS model will use these terms for “smoothing”.
How to implement the ETS model using Python?
→ Importing package
The required packages are imported. These are pandas for working with data and matplotlib for plotting graphs.
import pandas as pd
import matplotlib.pyplot as plt
%matplotlib inline
→ Analyze data
The dataset used here is the sales data. It is univariate time series data meaning that it has only one variable. The index column is assigned as the Month column of the dataset.
df = pd.read_csv('sales.csv',index_col='Month')
df.head()
df.plot()
To be able to work with the data, the ‘month’ column is changed to a datetime index form.
df.index = pd.to_datetime(df.index)
df.head()
→ Decomposition
The decomposition will be done using the statsmodels library. It has a seasonal_decompose function. This function takes the column name for which the season has to be decomposed and the type of seasonal component. It can be additive or multiplicative. It takes hit and trial to see which component to use. By seeing the graph we can see that it is not linear therefore the type has to be multiplicative.
from statsmodels.tsa.seasonal import seasonal_decompose
final = seasonal_decompose(df['Sales'],model='multiplicative')
Now from this, you can grab the seasonal component and the trend or even plot altogether.
final.trend.plot()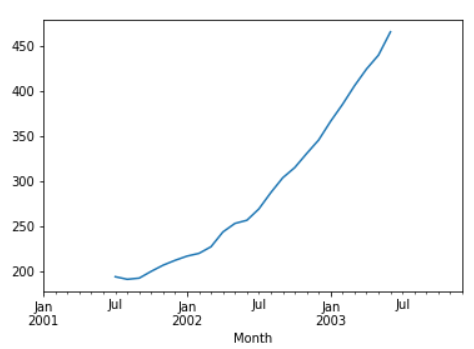
As seen from the above plot, the trend is upwards.
final.seasonal.plot()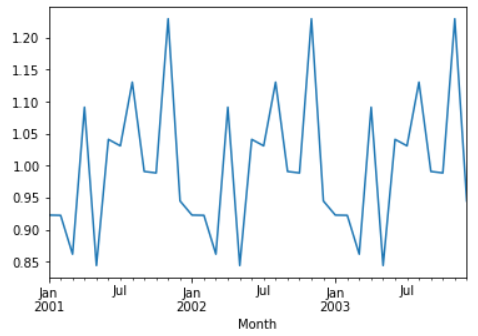
fig = final.plot()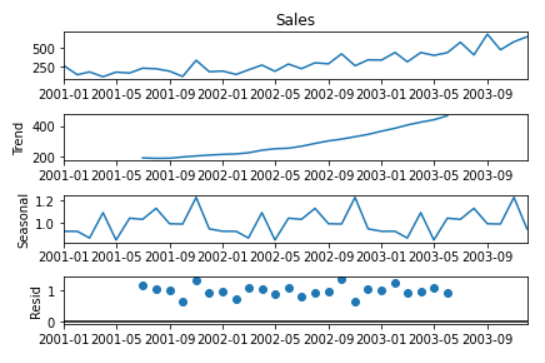
Conclusion
ETS models can be very useful for understanding the trend and seasonality of time series data. The python library ‘statsmodels’ makes it easier to plot the graph and analyze the data.
To know more about ‘statsmodels’, keep out the article below:
Refer to the notebook here.
Reach out to me: LinkedIn
Check out my other work: GitHub