How to implement EWMA plots using Python?
This article will help you understand EWMA and the implementation using Python.
What is EWMA?
EWMA stands for Exponentially Weighted Moving Average. It processes data in such a way that it gives less importance and weightage to the data which is further past in time. So it gives more weightage to the data that is recent.
Why is EWMA needed?
It is a better version of the SMA (Simple moving average) since SMA uses small windows for calculations leading to more noise. There is a lag in the start of the plot and it never reaches the peak. It also fails to give any information about future behavior and only shows the trends. This is the reason EWMA is helpful.
What is the math behind EWMA?
The formula for EWMA is as follows:
x(t) = input value
w(i) = applied weight which changes from i=0 to i=t
y(t) = output value
So the weight term w(i) is defined according to the adjust parameter (α).
- If talking in terms of span (s) — Period or N-day EW moving average, if s ≥ 1 then α = 2/(s+1).
- If talking in terms of center of mass (c), if c≥0 then α = 1/(1+c).
- If talking in terms of half-life(h) — time taken for the weight to reduce to half, if h>0 then α = 1 — exp(log 0.5/h)
- If talking in terms of smoothing factor, α can be set directly.
It easy to work with span and so the plots will be created using it.
How to implement EWMA using Python?
→ Importing packages
The basic packages like numpy and pandas are imported for dealing with data. To help with plotting, the matplotlib package is imported.
import numpy as np
import pandas as pd
import matplotlib.pyplot as plt
%matplotlib inline
→ Analyze data
The dataset used will be sales data. It is a univariate dataset that has the month and sales column. The data is read and the ‘Month’ column is mentioned as the index column.
df = pd.read_csv('sales.csv',index_col='Month')
df.head()
Now the ‘Month’ column is changed to a DateTime index so as to help with the further process.
df.index = pd.to_datetime(df.index)
df.head()
→ Creating SMA
The SMA can be created by adding an extra column and using the ‘rolling’ function and mention the window as 6 for 6 months and 12 for 12 months.
df['6SMA'] = df['Sales'].rolling(window=6).mean()
df.head()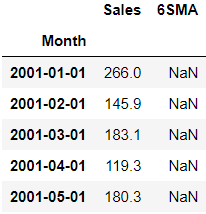
df['12SMA'] = df['Sales'].rolling(window=12).mean()
df.head()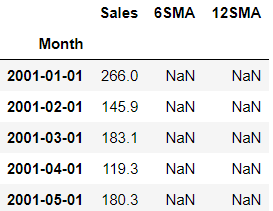
df.plot()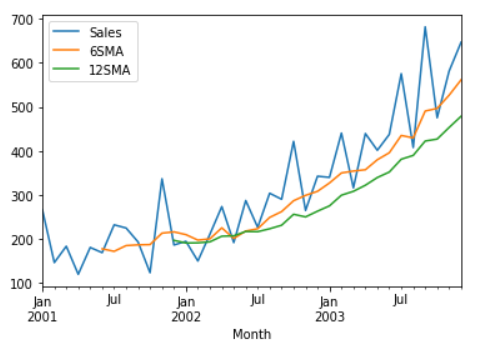
Take a note that, here while plotting SMA there is a lag initially. When the EWMA is plotted, this lag won’t be there.
→ Creating EWMA
The ‘ewm’ function is called to find the EWMA. The ‘span’ argument takes in the period like 12 for 12 months.
df['6EWMA'] = df['Sales'].ewm(span=12).mean()
df[['Sales','6EWMA']].plot()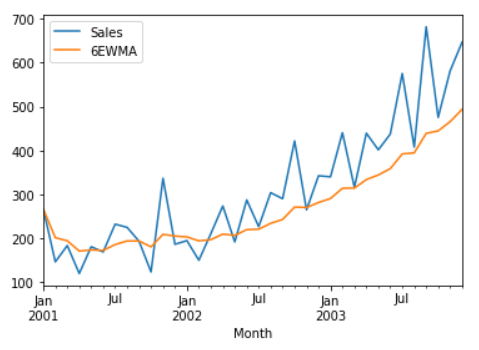
Taking a look at the EWMA plot, the initial lag is not present as seen with the SMA plot.
Conclusion
EWMA is a good statistic approach to learn about the trends in time series data. The implementation with Python is also made easy with the help of in-built functions.
Refer to the notebook here.
Reach out to me: LinkedIn
Check out my other work: GitHub