How to get financial data using Python?
A guide to understanding how to procure data for doing financial analysis using Python.

When you plan to work on using Python for finance, a particular form of data is needed. This data should be concerned with financial values. In this article, I will introduce two methods to get financial data using the Python language.
1) Method 1: Pandas — datareader
The first method that I have mentioned deals with getting data using Pandas-datareader. Pandas is an open-source Python library that is used for performing data analysis and is used as a manipulation tool. Check out this article mentioned below to know about Pandas in detail.
So the subpackage Pandas-datareader helps the user to create dataframes from the internet sources available. It allows one to connect to many sources like Yahoo Finance, World Bank, Google Analytics, St.Louis FED (FRED) and Kenneth French’s data library. After connecting, you can extract the data and read it in as a dataframe.
Now let’s see how we can use it!
Installing pandas-datareader
The installation can be done by using the command below:
pip install pandas-datareader
Importing the package
The pandas_datareader package is imported for use. Along with it, the datetime library is also imported. This library will help us pass datetime objects.
>>> import pandas_datareader.data as web
>>> import datetime
Setting the start and end date
Now we will set the start and end date so as to extract the data from this interval.
>>> start = datetime.datetime(2018,1,1)
>>> end = datetime.datetime(2020,1,1)
Creating the stocks dataframe
Now we will declare a variable that we want as a dataframe. Then we will call the ‘DataReader’ method. This method takes the values name, data_source, start date, end date.
So here we will consider the Microsoft data and the name will be written as ‘MSFT’, the source will be yahoo and the start and end dates are as declared above.
>>> data = web.DataReader('MSFT','yahoo',start,end)
>>> data.head()
2) Method 2: Quandl
The second method is to get data from Quandl. Quandl is a company and a source for financial or economic datasets. It offers a Python API which is free to use up to a limit, is very robust and helps to extract data from a variety of sources.
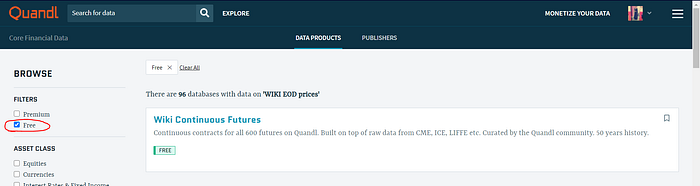
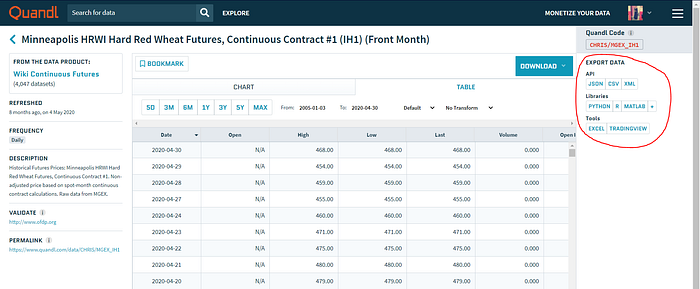
Quandl has provision to use premium services which are paid and also the basic services which are free. To avail of the services for free, Go to the Quandl website, and click on the ‘Core Financial data’ option. It is free to use and available to everyone. In the filter, by clicking on the ‘free’ option you can view the free data sources. Then you can either download the data in various formats like JSON, CSV and XML or you can also use the different APIs available for Python, R, MATLAB, etc. We will be using the Python API directly.
Installing Quandl
pip install quandl
Importing necessary packages
The quandl package is imported.
>>> import quandlExtracting the data
The data can be obtained by using the ‘get’ method. This method extracts a single time series. There is another method ‘get_table’ which extracts the entire database.
The format for Quandl’s database usage is: DATABASE_CODE/DATASET_CODE. The quandl codes can be found on the website for the respective datasets.
We will try extracting the petroleum prices from the US department.
>>> data1 = quandl.get('EIA/PET_RWTC_D')
>>> data1.head()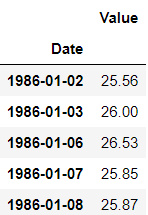
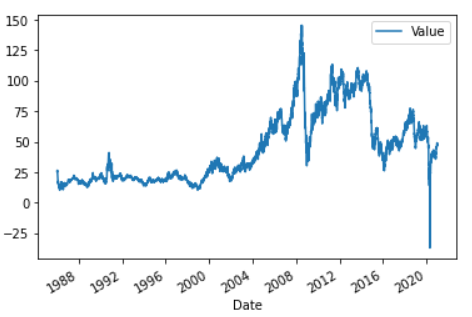
Plotting the data
>>> import matplotlib.pyplot as plt
>>> %matplotlib inline>>> data1.plot()
Let’s look into other data like Facebook.
>>> data2 = quandl.get('WIKI/FB')
>>> data2.head()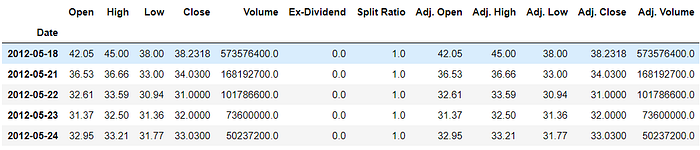
In case you do not want all these columns. The column number can be mentioned accordingly.
>>> data2 = quandl.get('WIKI/FB.1')
>>> data2.head()
Check out the official documentation of Pandas-datareader and Quandl.
Refer to the notebook for code here.
Reach out to me: LinkedIn
Check out my other work: GitHub

